Cleanroom managers face a critical paradox: FFU systems represent both the largest capital investment and the most frequent source of compliance failures in controlled environments. When an ISO 5 pharmaceutical suite fails particle count verification hours before a regulatory audit, the root cause typically traces back to one of three FFU-related decisions made months earlier—incorrect filter specification, inadequate airflow design, or suboptimal control integration.
The stakes have escalated significantly. FDA Form 483 citations related to environmental monitoring increased 34% between 2022-2024, with inadequate air filtration systems accounting for the majority of observations. As cleanroom classifications tighten and energy costs rise, selecting and optimizing FFU systems has shifted from a facilities management task to a strategic operational imperative requiring integration of engineering specifications, regulatory compliance, and lifecycle cost analysis.
Understanding FFU Technology: Core Components and Working Principles
Fundamental Operating Architecture
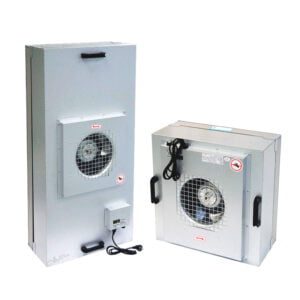
FFUs are self-contained, motorized devices that create unidirectional airflow in controlled environments. Each unit integrates three critical elements: a fan assembly, a HEPA or ULPA filter, and a housing designed for ceiling grid installation. Air moves through a pre-filter to capture larger particles, then passes through the fan section where it’s pressurized, and finally exits through the HEPA or ULPA filter into the cleanroom workspace.
The modular nature of FFUs provides significant operational flexibility. Units install in the plenum space above cleanroom ceilings, pushing filtered air downward through the workspace. This configuration allows facility managers to scale filtration capacity by adding or removing units based on process requirements or ISO classification changes. In my experience consulting for semiconductor fabs, this modularity reduces cleanroom modification timelines from weeks to days compared to central HVAC alterations.
Motor Technology and Performance Parameters
FFU performance hinges on motor selection. Permanent split capacitor (PSC) motors offer cost-effective, fixed-speed operation suitable for stable-load applications. Electronically commutated motors (ECM) provide variable speed control with 30-50% energy reduction compared to PSC equivalents. Standard units deliver 640+ CFM at medium speed, generating 90+ FPM face velocity while maintaining acoustic levels at 49 dBA measured 30 inches from the filter face.
Common dimensional configurations include 2’×2′, 2’×4′, and 4’×4′ footprints, designed to integrate with standard cleanroom ceiling grids. These dimensions align with modular cleanroom construction standards outlined in ISO 14644-3:2019, ensuring compatibility across manufacturers and simplifying retrofit projects.
Filter Efficiency and Particle Capture Mechanisms
HEPA filters capture 99.99% of particles ≥0.3 micrometers through three physical mechanisms: interception, impaction, and diffusion. ULPA filters extend this capability to 99.999% efficiency at ≥0.12 micrometers, necessary for ISO 5 and stricter classifications. The filter media itself—typically composed of randomly arranged glass fiber mats—creates a tortuous path that forces particles into contact with fibers where van der Waals forces secure them.
Pre-filters rated MERV 7 at 30% ASHRAE efficiency extend HEPA/ULPA service life by capturing larger particles before they load the final filter. This two-stage approach reduces total cost of ownership by allowing inexpensive pre-filter replacements every 3-6 months while extending HEPA/ULPA service intervals to 1-3 years depending on environmental conditions.
FFU Standard Specifications and Performance Parameters
| Parameter | Specification Range | Industry Standard |
|---|---|---|
| Unit Dimensions | 2’×2′, 2’×4′, 4’×4′ | IEST-RP-CC001 |
| Airflow Capacity | 640+ CFM at medium speed | UL 900 certified |
| Face Velocity | 90+ FPM average | ISO 14644-3 compliant |
| Acoustic Level | 49 dBA @ 30″ from filter face | Measured per ISO 14644-3 |
| Motor Technology | PSC or ECM variable speed | UL 900 listed |
| Filter Efficiency | HEPA: 99.99% @ ≥0.3μm; ULPA: 99.999% @ ≥0.12μm | IEST-RP-CC001 |
Source: ISO 14644-3:2019, UL 900 Standard for Air Filter Units
Selecting the Right FFU: A Technical Guide to Specifications and Cleanroom Class Alignment
ISO Classification Requirements and ACH Calculations
ISO cleanroom classification directly determines FFU density requirements. ISO 5 environments demand 240-480 air changes per hour (ACH), typically requiring ceiling coverage approaching 80-100% with fan filter units. ISO 7 classifications require 60-90 ACH with approximately 15-20% ceiling coverage, while ISO 8 environments operate effectively with 20-30 ACH.
Calculate required FFU quantity using this formula: (Room Volume × Required ACH) ÷ (CFM per FFU × 60). A 2,000 cubic foot ISO 7 cleanroom requiring 75 ACH needs: (2,000 × 75) ÷ (640 × 60) = 3.9, rounded to 4 FFUs minimum. This calculation assumes uniform distribution; actual layouts require adjustment for workstation placement and equipment heat loads.
Filter Type Selection Criteria
HEPA filters serve the majority of pharmaceutical, medical device, and general biotech applications in ISO 6-8 classifications. ULPA filters become necessary when particle specifications require removal of submicron contaminants below 0.3 micrometers—common in semiconductor lithography, aseptic filling operations, and certain nanotechnology processes. The performance difference carries cost implications: ULPA filters typically cost 40-60% more than equivalent HEPA units and create higher static pressure requiring more powerful fan motors.
I’ve observed many facilities over-specify ULPA filters when HEPA units would satisfy regulatory requirements. Review your specific ISO classification needs, particle count specifications, and process contamination sensitivity before defaulting to ULPA technology.
Filter Type Selection by ISO Cleanroom Classification
| ISO Class | Filter Type | ACH Requirement | Typical Applications |
|---|---|---|---|
| ISO 5 | ULPA (99.999% @ 0.12μm) | 240-480 | Semiconductor fabrication, aseptic processing |
| ISO 6 | HEPA or ULPA | 150-240 | Pharmaceutical manufacturing, sterile compounding |
| ISO 7 | HEPA (99.99% @ 0.3μm) | 60-90 | Medical device assembly, biotech production |
| ISO 8 | HEPA (99.99% @ 0.3μm) | 20-30 | General pharmaceutical, packaging areas |
Note: ACH values determine FFU density per cleanroom volume.
Source: ISO 14644-3:2019, IEST Recommended Practices
Electrical Specifications and Operational Features
Voltage selection aligns with facility electrical infrastructure: 115V for North American facilities, 230V for international installations, and 277V for commercial buildings with high-leg delta systems. Room-side replaceable (RSR) filter designs eliminate the need to access plenum spaces during filter changes, reducing maintenance labor costs and minimizing cleanroom disruption.
Three-speed manual controls (Low/Medium/High) simplify commissioning and air balancing for fixed-load cleanrooms. Variable speed ECM motors suit applications with fluctuating thermal loads or processes requiring dynamic airflow adjustment. Facilities operating under USP <797> guidelines for sterile compounding or cGMP pharmaceutical manufacturing should prioritize models with integrated differential pressure monitoring and filter replacement alarms to maintain continuous compliance documentation.
FFU Installation Best Practices: From Layout Planning to Commissioning
Layout Design and Coverage Distribution
FFU placement follows three core principles: uniform air velocity distribution, elimination of stagnant zones, and accommodation of process equipment heat loads. Mount units in modular ceiling grids using 1/4-20 UNC threaded inserts on unit corners for guy-wire suspension, or install directly in solid ceilings using stainless steel mounting frames. Low-profile designs accommodate standard 9-foot ceiling heights without compromising workspace ergonomics.
Coverage patterns differ by ISO class. ISO 5 rooms require near-complete ceiling coverage with FFUs, creating unidirectional laminar flow. ISO 7-8 environments use dispersed placement at 15-25% ceiling coverage, positioning units to counteract thermal plumes from equipment and personnel. Map heat sources during design phase and increase FFU density in zones with process equipment, autoclaves, or personnel gowning stations.
Mechanical Installation and Sealing Requirements
Proper installation begins with verification of ceiling grid load capacity. Standard 2’×4′ FFUs weigh 85-120 pounds depending on motor type; verify grid systems support this distributed load plus a 50% safety factor. Clip-on filter designs and standardized frames reduce installation time compared to bolt-in configurations.
Internal baffling plates and diffuser panels ensure uniform air distribution across the filter face, eliminating velocity variations that create turbulent mixing at the filter-to-room interface. Gasket seals between filter frames and unit housings require compression within manufacturer specifications—typically 0.125-0.25 inches of deflection—to prevent bypass leakage. We’ve identified inadequate gasket compression as the leading cause of failed leak tests during commissioning, resulting from over-tightened mounting hardware that warps frames rather than compressing gaskets.
Commissioning and Performance Verification
Initial qualification testing follows ISO 14644-3 protocols. Conduct airflow uniformity testing using a calibrated anemometer at a 9-point grid pattern 6-12 inches below the filter face. Velocity readings should fall within ±20% of the mean value. Perform filter leak testing using PAO (poly-alpha-olefin) or DOP (dioctyl phthalate) aerosol challenge at 10-20% upstream concentration, scanning the filter face and perimeter seals with a photometer probe. Any reading exceeding 0.01% penetration indicates a leak requiring filter replacement or gasket adjustment.
Pressure differential verification confirms room-to-room cascades maintain ISO classification. Install calibrated differential pressure gauges with ±0.001 inch water column accuracy. Document baseline readings at commissioning; these values serve as reference points for ongoing monitoring and filter loading assessments.
Required Certification Tests for FFU Installation
| Test Category | Test Method | Compliance Standard | Frequency |
|---|---|---|---|
| Airborne Particle Count | Optical particle counter | ISO 14644-1, 14644-3 | Initial + annual |
| Airflow Uniformity | Anemometer grid measurement | ISO 14644-3 | Initial + biennial |
| Filter System Leakage | Aerosol challenge + photometry | ISO 14644-3 | Initial + post-filter change |
| Pressure Differential | Manometer verification | ISO 14644-2 | Continuous monitoring |
| HEPA Leak Scanning | PAO or DOP scanning | IEST-RP-CC034 | Annual + post-installation |
Source: ISO 14644-3:2019, ISO 14644-2:2015
Optimizing FFU Performance: Monitoring, Control Strategies, and Energy Efficiency
Speed Control Architecture and Energy Implications
Remote speed control systems allow centralized adjustment of fan RPM through analog voltage signals or digital communication protocols. Three-speed configurations provide adequate control for most applications: low speed for unoccupied periods, medium for standard operations, and high for recovery after material transfers or equipment maintenance. ECM motors accept 0-10V control signals enabling infinite speed modulation between minimum and maximum airflow specifications.
Energy consumption varies significantly by motor technology. ECM models operate at 1.4 running amps at 115V, consuming approximately 160W during continuous operation. PSC motors at equivalent airflow draw 2.2-2.8 amps, consuming 250-320W. Over 8,760 annual operating hours, this difference translates to 788-1,402 kWh per FFU—substantial when multiplied across 50-200 unit installations typical in pharmaceutical facilities.
Night Mode Operation and Filter Life Extension
Night service switching reduces fan speed during unoccupied hours, delivering 25% operational cost savings while extending filter service life. Lower airflow velocity reduces particle impaction force on filter media, slowing pressure drop accumulation. Program building management systems to activate night mode during third shift, weekends, or scheduled production downtime.
Implement staged startup protocols to prevent pressure surges that can dislodge accumulated particles from pre-filters. Ramp fan speed from night mode to operational speed over 5-10 minutes rather than instantaneous switching. This controlled transition maintains room pressurization while protecting filter integrity.
Differential Pressure Monitoring and Filter Loading Assessment
Filter replacement decisions should derive from performance data rather than arbitrary time intervals. Install differential pressure sensors measuring static pressure drop across filter assemblies. New HEPA filters exhibit 0.5-0.8 inches water column pressure drop at rated airflow. Schedule replacement when differential pressure reaches 2× initial reading—typically 1.5-1.8 inches water column.
Filter backpressure alarms integrated into FFU control panels provide visual indication of filter loading. Color-coded LED indicators signal green (normal operation), yellow (monitor condition), and red (replacement required) status. This real-time feedback enables predictive maintenance scheduling rather than reactive emergency replacements that disrupt production.
FFU Energy Efficiency and Control Parameters
| Control Feature | Technical Specification | Energy Impact | Use Case |
|---|---|---|---|
| ECM Variable Speed | 0-100% speed modulation | 30-50% energy reduction vs PSC | Dynamic load applications |
| Three-Speed Manual | Low/Medium/High settings | Standard efficiency | Fixed-load cleanrooms |
| Night Service Mode | Automated low-speed scheduling | 25% operational cost savings | Off-hours operation |
| Running Current | 1.4A @ 115V (ECM models) | 160W typical consumption | Continuous pharmaceutical production |
| Filter Backpressure Monitoring | Differential pressure sensor | Prevents overconsumption | All cleanroom classes |
Source: IEST Recommended Practices, ISO 14644-2:2015
Advanced FFU Integration: Smart Controls, IoT, and Data-Driven Management
Communication Protocol Implementation
RS485 and Modbus RTU/TCP protocols enable FFU integration with building management systems, SCADA platforms, and standalone cleanroom monitoring systems. Multi-drop RS485 networks support up to 32 FFUs on a single communication bus, transmitting fan speed, runtime hours, filter status, and fault codes to central monitoring stations. Modbus TCP operates over standard Ethernet infrastructure, simplifying integration with PLCs and HMI systems already deployed in pharmaceutical manufacturing environments.
Each FFU receives a unique network address during commissioning. Configure communication parameters—baud rate, parity, stop bits—consistently across all devices to prevent communication errors. Standard configurations use 9600 baud, 8 data bits, no parity, 1 stop bit (9600-8-N-1) for reliable data transmission over distances up to 4,000 feet.
Dynamic Set-Point Control and Pressure Cascade Management
Advanced control systems implement dynamic fan speed adjustment to maintain target pressure differentials regardless of door openings, airlock cycles, or process equipment operation. Pressure sensors in each cleanroom zone feed real-time data to PID control algorithms that adjust FFU speed to compensate for disturbances. Response times under 15 seconds prevent pressure reversals that compromise ISO classification during transient events.
Pressure cascade configurations maintain progressively higher pressure from clean to less-clean zones. A typical pharmaceutical suite maintains ISO 5 aseptic core at +0.05 inches water column relative to ISO 7 support spaces, which maintain +0.03 inches relative to ISO 8 corridors, which maintain +0.02 inches relative to unclassified areas. Dynamic set-point control automatically adjusts FFU arrays in each zone to preserve these differentials during normal operations.
Environmental Data Integration and Compliance Documentation
Integrated monitoring systems log temperature, humidity, particle counts, and pressure differentials alongside FFU operational parameters. This comprehensive dataset enables correlation analysis between environmental conditions and equipment performance. Identify patterns such as particle count increases preceding filter loading alarms, or temperature excursions correlating with inadequate airflow during high-occupancy periods.
Continuous data logging satisfies regulatory requirements for environmental monitoring documentation under FDA 21 CFR Part 11, EU GMP Annex 11, and cGMP guidelines. Configure systems to generate automated alerts when parameters drift outside validated ranges, enabling corrective action before excursions trigger batch impact investigations.
Smart FFU Integration Communication Protocols
| Protocol/Feature | Capability | Data Output | System Integration |
|---|---|---|---|
| RS485 | Multi-drop serial communication | Fan speed, filter status, runtime hours | BMS/SCADA platforms |
| Modbus RTU/TCP | Industry-standard protocol | Temperature, humidity, pressure, particle counts | PLCs, HMI systems |
| Dynamic Set-Point Control | Real-time auto-adjustment | Maintains ISO compliance during load changes | Pharmaceutical cGMP facilities |
| Centralized Group Control | Zone-based management | Pressure differential cascades | Multi-room cleanroom suites |
Note: Communication protocols enable predictive maintenance and compliance documentation.
Source: ISO 14644-2:2015, IEST Recommended Practices
Proactive Maintenance and Troubleshooting: Ensuring Long-Term Reliability and Compliance
Condition-Based Filter Replacement Strategies
Abandon calendar-based filter replacement schedules. Condition-based maintenance uses three performance indicators: differential pressure measurements, particle count trends, and visual inspection results. Pre-filters showing visible dirt accumulation or discoloration require replacement regardless of time in service. HEPA/ULPA filters operating within pressure drop specifications and passing particle count testing remain serviceable even if installed for 2-3 years.
High-contamination environments—those with significant outdoor air infiltration, construction activities nearby, or process operations generating particulates—may require pre-filter replacement every 3 months. Climate-controlled laboratory environments with minimal contamination sources extend pre-filter service to 6-9 months. Document baseline particle counts during commissioning and trend data quarterly to identify gradual degradation before compliance failures occur.
Tool-Free Maintenance Access and Filter Replacement
Room-side replaceable FFU designs eliminate plenum access requirements during filter changes. Maintenance technicians work from within the cleanroom, removing filters through hinged access panels or twist-lock mechanisms. This approach reduces filter replacement time from 45-60 minutes per unit to 15-20 minutes while minimizing cleanroom pressurization disturbances.
Challenge port kits simplify leak testing after filter installation. These permanently mounted ports accept PAO injection probes and sampling tubes without requiring specialized fixtures. Perform abbreviated leak tests within 30 minutes of filter installation to verify gasket sealing before resuming operations.
Component Lifecycle Management and Predictive Replacement
Fan motor bearings represent the primary wear component in FFU assemblies. ECM motors typically deliver 40,000-50,000 operating hours—approximately 5-7 years of continuous operation—before bearing noise increases indicate impending failure. Implement vibration analysis during annual maintenance inspections to detect bearing degradation before catastrophic failure. Baseline vibration measurements during commissioning provide reference values for comparison; vibration amplitude increases exceeding 50% or acoustic noise increases above 5 dBA signal replacement timing.
ECM motor controllers have 7-10 year service lives. Erratic speed response, failure to reach set-point velocity, or intermittent communication faults indicate controller degradation. Stock spare controllers for critical cleanrooms to minimize downtime during unplanned failures.
FFU Component Maintenance Schedule and Indicators
| Component | Replacement Interval | Monitoring Method | Performance Indicator |
|---|---|---|---|
| MERV 7 Pre-Filter | 3-6 months | Visual inspection + airflow measurement | Visible dirt accumulation |
| HEPA/ULPA Filter | 1-3 years | Differential pressure + particle count | Backpressure >2× initial reading |
| Filter Gasket Seal | Every filter change | Aerosol leak test | >0.01% penetration failure |
| Fan Motor Bearing | 5-7 years or 40,000 hours | Vibration analysis + acoustic monitoring | Noise increase >5 dBA |
| ECM Motor Controller | 7-10 years | Speed response verification | Erratic speed or failure to adjust |
Note: High-contamination environments may require 3-month pre-filter replacement cycles.
Source: ISO 14644-3:2019, IEST-RP-CC001
Troubleshooting Common Performance Issues
Low airflow conditions despite high fan speed settings indicate filter loading, gasket bypass, or motor degradation. Measure differential pressure first: elevated readings confirm filter loading requiring replacement. Normal pressure drop with low airflow suggests motor failure or control signal issues. Verify control voltage at motor terminals matches set-point commands.
Particle count excursions during otherwise normal operations point to filter leaks or room pressurization failures. Conduct localized leak scanning around filter perimeters and gasket seals using handheld particle counters. Pressure differential losses between adjacent zones allow particle migration from less-clean areas; verify FFU operation in upstream zones maintains specified pressure cascades.
Premature filter loading—reaching replacement criteria in less than 12 months—indicates inadequate pre-filtration, contamination source introduction, or incorrect filter specification for the application. Review process changes, construction activities, or facility modifications that may have increased particle generation. Consider upgrading pre-filter efficiency from MERV 7 to MERV 10-11 in high-challenge environments.
FFU system optimization requires balancing three priorities: regulatory compliance, energy efficiency, and operational flexibility. Start by verifying current ISO classification requirements match installed FFU capacity and filter specifications—misalignment here creates either compliance risk or unnecessary operating costs. Implement differential pressure monitoring and condition-based maintenance protocols to extend filter service life while maintaining documented performance verification. Deploy ECM technology and night service controls in facilities operating 24/7 to capture 30-40% energy reductions that generate ROI within 18-24 months.
Need specialized cleanroom filtration solutions engineered for pharmaceutical, semiconductor, or biotech applications? YOUTH delivers FFU systems with integrated compliance monitoring, energy-efficient ECM motors, and room-side replaceable designs that reduce total cost of ownership while maintaining validated environmental conditions. Our technical team provides application-specific sizing, control system integration support, and commissioning services aligned with ISO 14644 qualification requirements.
Questions about FFU specifications for your facility upgrade or new construction project? Contact us for technical consultation and system design recommendations.
Frequently Asked Questions
Q: What are the key technical and operational advantages of ECM motors over PSC motors in Fan Filter Units?
A: ECM motors provide superior energy efficiency and control flexibility compared to PSC motors, with variable speed drives that allow real-time airflow adjustment. This enables applications to lower fan speeds during non-production hours, reducing energy consumption to as low as 1.4 running amps. For long-term operational cost savings and dynamic control, ECM technology is the preferred choice, especially in facilities implementing ISO 14644-2:2015 monitoring plans that require consistent environmental performance.
Q: How do I determine the correct Air Changes Per Hour (ACH) and subsequent FFU density for a specific ISO class cleanroom?
A: The required ACH is a direct function of your target ISO classification, with higher-class cleanrooms (e.g., ISO 5) requiring significantly more air changes and a greater density of FFUs. You must calculate the total airflow volume needed based on the room’s cubic footage and the ACH stipulated for your ISO class, then divide by the airflow of a single FFU (e.g., 640+ CFM) to determine the quantity. This foundational calculation ensures compliance with air cleanliness standards as defined in ISO 14644-1 and ISO 14644-2.
Q: What are the critical compliance tests required for FFU system certification and leak prevention according to ISO 14644?
A: Certification mandates three core tests as per ISO 14644-3: an airborne particle count test, an air flow test, and an air pressure difference test. For comprehensive leak detection, the standard also outlines optional tests, including an installed filter system leakage test with aerosol challenge. It is crucial to mutually select and agree upon these tests with your supplier prior to commissioning, as detailed in ISO 14644-3:2019.
Q: When should a cleanroom use ULPA filters instead of standard HEPA filters in its FFUs?
A: ULPA filters are necessary for the most stringent cleanroom classifications, such as ISO 5 and above, where removal of particles as small as 0.12 microns at 99.999% efficiency is required. While HEPA filters (99.99% efficient at 0.3 microns) are sufficient for most applications like ISO 7 or ISO 8, semiconductor manufacturing and other ultra-sensitive processes demand ULPA performance. The selection should be guided by IEST-RP-CC001: HEPA and ULPA Filters and your specific particle control objectives.
Q: What is the most effective strategy for optimizing FFU energy consumption without compromising cleanroom integrity?
A: Implementing a night service switch mode is a highly effective strategy, putting FFUs into a low-energy state during off-hours and potentially saving 25% of fan operating costs. For finer control, ECM-based FFUs with centralized monitoring systems can dynamically adjust fan speeds to maintain minimum required pressure differentials and airflow, responding in real-time to environmental conditions. This proactive approach aligns with energy conservation goals while upholding the monitoring requirements of ISO 14644-2:2015.
Q: What are the best practices and indicators for determining HEPA/ULPA filter replacement cycles?
A: Filter replacement should be driven by performance data and visible inspection rather than a fixed time schedule. Key indicators include a sustained increase in filter backpressure, visible clogging or discoloration, and a decline in airflow velocity that cannot be compensated by increased fan speed. While typical HEPA/ULPA filter life is 1-3 years, environments with heavy particulate loads may require more frequent changes, a process supported by using challenge port kits for leak testing as described in ISO 14644-3:2019.
Q: How do room-side replaceable (RSR) filters impact maintenance operations and cleanroom downtime?
A: RSR filters significantly reduce maintenance downtime by allowing filter replacement from within the cleanroom without needing to access the plenum above or remove the entire FFU unit. This enables in-house teams to perform tool-free replacements quickly, minimizing disruption to production schedules and maintaining the cleanroom’s integrity. This design feature is particularly valuable in environments where filters are replaced often, supporting continuous compliance with minimal operational interference.
Related Contents:
- ULPA vs HEPA Filters for Laminar Flow Units
- Top 3 Fan Filter Unit Applications in Pharmaceutical Manufacturing
- Optimizing Airflow Patterns in Fan Filter Unit Systems
- Proven FFU Maintenance Tips to Extend Unit Lifespan
- HEPA vs ULPA Filters: Choosing the Right Option
- Cleanroom Fan Filter Unit Specifications | Technical Comparison
- HEPA vs ULPA Housing Boxes: Choosing the Right Filtration
- HEPA Filter Systems | Air Handling Equipment Specifications
- ULPA vs HEPA Housing Boxes: Cleanroom Performance Data


