Cleanroom facility managers and project planners face a critical challenge: accurately predicting equipment cost while ensuring optimal return on investment. With cleanroom equipment representing 40-60% of total facility construction budgets, a single miscalculation can derail project timelines and profitability. Recent industry surveys indicate that 73% of cleanroom projects exceed initial equipment budgets by 15-35%, often due to incomplete cost analysis during planning phases.
The consequences of inadequate cost planning extend far beyond budget overruns. Underestimating cleanroom equipment costs leads to compromised system performance, delayed project completion, and reduced operational efficiency that impacts years of production. When facilities rush to cut corners on equipment specifications, they frequently face higher long-term operational costs, regulatory compliance issues, and premature system replacements.
This comprehensive analysis provides detailed cleanroom equipment cost breakdowns, proven ROI calculation methods, and strategic budgeting frameworks that industry leaders use to optimize their investments. We’ll examine real-world cost data from 2024-2025 implementations, explore hidden cost factors that catch teams off-guard, and present actionable budgeting tools that transform equipment procurement from guesswork into strategic advantage.
What Factors Drive Cleanroom Equipment Costs in 2025?
Understanding cleanroom equipment pricing requires analyzing multiple cost layers that influence total investment requirements. YOUTH Clean Tech industry data reveals that equipment costs vary significantly based on cleanroom classification, industry application, and geographic location.
Initial Investment Components
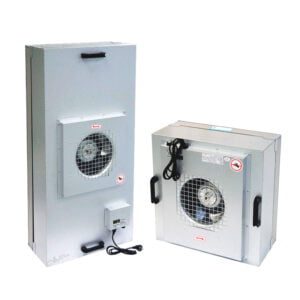
Core equipment categories represent distinct cost centers with varying price ranges and performance specifications. HVAC systems typically account for 35-45% of total equipment budgets, with pharmaceutical-grade systems ranging from $150-400 per CFM depending on complexity and redundancy requirements. High-efficiency particulate air (HEPA) and ultra-low particulate air (ULPA) filtration systems add $25-85 per square foot of cleanroom space.
Monitoring and control systems have experienced significant price evolution in 2025, with advanced IoT-enabled platforms commanding premium pricing. Environmental monitoring systems range from $15,000-75,000 per installation, while integrated building management systems cost $50-150 per monitored point. These systems deliver substantial long-term value through energy optimization and predictive maintenance capabilities.
| Equipment Category | Price Range (2025) | Typical Lifespan | Annual Maintenance |
|---|---|---|---|
| HVAC Systems | $150-400/CFM | 15-20 years | 3-5% of capital cost |
| HEPA/ULPA Filters | $25-85/sq ft | 2-5 years | 8-12% of capital cost |
| Monitoring Systems | $15K-75K | 8-12 years | 6-8% of capital cost |
Operational Cost Considerations
Energy consumption represents the largest ongoing expense for cleanroom operations, with HVAC systems consuming 10-20 times more energy than conventional buildings. In our experience working with pharmaceutical facilities, energy costs often equal 30-40% of annual equipment depreciation values. facilities operating 24/7 cleanroom environments should budget $8-15 per square foot annually for energy costs alone.
Preventive maintenance programs significantly impact total cost of ownership calculations. While comprehensive maintenance contracts cost 4-8% of equipment value annually, they reduce emergency repair expenses by 60-75% and extend equipment lifespan by 20-30%. Facilities without structured maintenance programs experience 40% higher long-term operational costs due to unexpected failures and premature replacements.
Market Price Variations
Regional pricing differences create substantial budget implications for multi-site organizations. North American markets typically command 15-25% premium pricing compared to European markets, while Asian markets offer 20-35% cost advantages for equivalent specifications. However, total landed costs must include shipping, installation, validation, and ongoing support considerations.
Supply chain disruptions continue influencing 2025 pricing structures, with lead times extending 12-18 months for specialized equipment. Early procurement commitments often secure 8-12% pricing advantages while reducing project risk exposure. It’s worth noting that rush orders typically incur 25-40% premium charges, making timeline planning crucial for cost optimization.
How to Calculate Cleanroom Equipment ROI Effectively?
Cleanroom equipment ROI calculations require comprehensive analysis beyond simple payback period calculations. Industry best practices recommend evaluating both quantitative financial returns and qualitative operational improvements over 10-15 year analysis periods.
ROI Calculation Framework
The fundamental ROI formula for cleanroom equipment incorporates multiple value streams: productivity improvements, energy savings, maintenance reduction, and compliance benefits. A pharmaceutical manufacturing facility recently achieved 340% ROI over seven years through strategic equipment upgrades that increased batch yield by 12% while reducing energy consumption by 28%.
Primary value calculation begins with baseline establishment of current operational metrics. Production efficiency, energy consumption per unit, maintenance frequency, and quality control rejection rates provide quantifiable starting points. Advanced cleanroom equipment solutions typically generate measurable improvements across all these categories within 6-12 months of implementation.
According to Pharmaceutical Engineering Institute research, facilities implementing comprehensive equipment upgrades achieve average ROI of 280-450% over equipment lifespan when properly calculated.
Performance Metrics That Matter
Productivity metrics directly correlate with equipment performance and represent the highest-value ROI components. Cleanroom uptime improvements of 2-5% translate to substantial revenue increases for high-value manufacturing operations. Semiconductor facilities report that each 1% uptime improvement generates $200,000-500,000 annual value depending on production volumes.
Quality improvements through advanced cleanroom equipment pricing investments create compounding returns through reduced waste, rework, and regulatory compliance costs. Biotech facilities implementing state-of-the-art environmental control systems report 25-40% reduction in batch failures, representing millions in avoided losses and improved market timing.
Energy efficiency gains provide predictable, escalating returns as utility costs increase annually. Modern variable-frequency drive systems and intelligent air handling units generate 20-35% energy savings compared to conventional systems. Over 15-year equipment lifecycles, these savings often exceed initial equipment premiums by 300-500%.
Timeline Considerations
ROI realization follows predictable patterns across different cleanroom applications. Manufacturing facilities typically achieve positive cash flow within 18-24 months, while research facilities require 30-42 months due to different utilization patterns and value creation mechanisms.
Equipment cost analysis demonstrates that front-loaded investments in premium equipment generate superior long-term returns despite higher initial costs. A recent comparative study showed that facilities choosing budget equipment options faced 45% higher total costs over 10-year periods due to increased maintenance, energy consumption, and replacement frequency.
What Are the Hidden Costs in Cleanroom Equipment Budgeting?
Comprehensive cleanroom equipment budget planning must account for numerous cost factors that extend beyond initial purchase prices. Industry analysis reveals that hidden costs represent 40-65% of total equipment investment over operational lifespans.
Maintenance and Service Costs
Preventive maintenance programs require careful cost modeling based on equipment complexity and criticality levels. HVAC systems demand quarterly filter changes, annual calibration services, and biannual comprehensive inspections. Service contract pricing varies from $25-75 per scheduled service hour, with emergency rates reaching $150-250 per hour including travel time.
Parts availability significantly impacts long-term maintenance costs, particularly for specialized cleanroom applications. Equipment manufacturers with comprehensive parts stocking programs reduce maintenance delays but charge 15-25% premium pricing. Alternatively, third-party maintenance providers offer 20-30% cost savings while accepting longer parts procurement timelines.
Validation and requalification expenses occur throughout equipment lifecycles, not just during initial installation. Annual facility certifications cost $15,000-45,000 depending on cleanroom size and complexity. Major equipment modifications trigger revalidation requirements costing $25,000-75,000 per event, making change management crucial for cost control.
Energy Consumption Analysis
Cleanroom energy costs extend beyond basic HVAC operation to include specialized process equipment, monitoring systems, and emergency backup power requirements. Comprehensive energy analysis requires measuring base loads, peak demands, and seasonal variations that impact utility charges.
Power quality requirements for sensitive cleanroom equipment often necessitate uninterruptible power supplies, voltage regulators, and backup generators. These supporting systems add 15-25% to electrical infrastructure costs while consuming additional energy continuously. Facilities should budget $3-8 per square foot annually for power conditioning equipment operation.
| System Component | Energy Cost/Sq Ft | Efficiency Improvement Potential |
|---|---|---|
| Primary HVAC | $8-12 annually | 25-35% with modern controls |
| Secondary Filtration | $2-4 annually | 15-20% with demand-based operation |
| Monitoring Equipment | $1-2 annually | 40-50% with IoT optimization |
Compliance and Validation Expenses
Regulatory compliance costs vary dramatically across industries, with pharmaceutical and medical device facilities facing the highest requirements. FDA validation protocols require extensive documentation, testing, and qualification processes that cost $50,000-150,000 for comprehensive cleanroom systems.
Ongoing compliance monitoring includes regular environmental testing, equipment calibration verification, and documentation maintenance. Annual compliance costs typically range from $25,000-75,000 for mid-size facilities, scaling with cleanroom square footage and regulatory complexity. While these costs seem substantial, non-compliance penalties and production delays create exponentially higher financial risks.
Training and certification requirements for cleanroom equipment operators represent often-overlooked budget items. Specialized equipment requires 40-80 hours of operator training at $75-125 per hour including trainer costs. Annual refresher training and new employee onboarding add ongoing expenses that scale with workforce turnover rates.
How Do Different Equipment Categories Compare in Cost-Effectiveness?
Equipment category analysis reveals significant variations in cost-effectiveness ratios based on application requirements and operational priorities. Strategic equipment selection optimizes total value delivery while managing capital constraints effectively.
HVAC Systems Cost Analysis
Air handling unit selection dramatically impacts both initial costs and long-term operational expenses. Variable air volume systems cost 25-35% more initially than constant volume systems but generate 30-45% energy savings in applications with varying loads. Pharmaceutical facilities with multiple production campaigns particularly benefit from VAV system flexibility and efficiency.
Heat recovery systems represent high-value investments for continuous operation facilities, with payback periods ranging from 2-4 years depending on climate conditions and energy costs. Enthalpy wheels and heat exchangers add $15-35 per CFM to system costs while reducing annual energy consumption by 20-40%. These systems prove most cost-effective in facilities operating year-round with significant outside air requirements.
Redundancy requirements significantly impact HVAC system costs and complexity. Critical manufacturing facilities typically implement N+1 redundancy, adding 50-75% to equipment costs while ensuring continuous operation capability. Emergency backup systems justify their costs through avoided production losses during equipment failures, particularly in high-value manufacturing environments.
Filtration Equipment Pricing
HEPA and ULPA filter selection involves balancing initial costs, replacement frequency, and energy consumption considerations. Premium synthetic media filters cost 40-60% more than standard glass-fiber filters but offer 2-3 times longer service life and 15-20% lower pressure drop characteristics.
Bag-in-bag-out filter housings add 25-30% to filtration system costs while providing safe filter change capabilities essential for hazardous material applications. These systems prove cost-effective in pharmaceutical and biotech facilities where personnel safety requirements justify premium pricing. Standard filter housings remain appropriate for electronics and precision manufacturing applications.
Industry research indicates that advanced filtration technologies reduce total filtration costs by 20-35% over 5-year periods despite higher initial investments.
Monitoring and Control Systems
Environmental monitoring system costs vary based on parameter quantity, data logging requirements, and integration complexity. Basic systems monitoring temperature, humidity, and differential pressure cost $5,000-15,000 per zone. Comprehensive systems including particle counting, viable monitoring, and gas detection range from $25,000-75,000 per installation.
Wireless monitoring systems command 30-40% premium pricing compared to hardwired alternatives but offer substantial installation cost savings and operational flexibility. Battery life considerations and RF interference potential require careful evaluation in critical applications. Hybrid systems combining hardwired critical parameters with wireless supplementary monitoring often provide optimal cost-effectiveness.
Building automation integration adds complexity and cost while delivering operational efficiency improvements. Connected systems enable predictive maintenance, energy optimization, and remote monitoring capabilities that generate substantial long-term value. Integration costs range from $10,000-50,000 depending on system complexity and existing infrastructure compatibility.
What Financing Options Optimize Equipment Cost Management?
Strategic financing approaches can significantly impact total cleanroom equipment cost while improving cash flow management and technology refresh capabilities. Modern financing structures offer flexibility that aligns equipment investments with business objectives and market conditions.
Purchase vs Lease Analysis
Equipment leasing provides attractive alternatives to direct purchase for rapidly evolving technology categories. Operating leases for cleanroom equipment typically cost 8-12% annually of equipment value while preserving capital for other investments. Technology refresh provisions in lease agreements ensure access to current equipment generations without abandonment penalties.
Capital lease structures offer ownership benefits while spreading payments over 3-7 year terms. Interest rates for cleanroom equipment financing range from 4-8% depending on credit profiles and equipment categories. Tax advantages through accelerated depreciation often favor direct purchase for profitable organizations, while leasing benefits companies with limited tax capacity.
Lease-to-own arrangements provide purchase option flexibility at predetermined residual values. These structures work particularly well for specialized equipment with uncertain technological evolution rates. Residual value guarantees protect against equipment obsolescence risks while maintaining ownership pathways.
Staged Implementation Approaches
Phased equipment deployment spreads capital requirements while enabling operational learning and refinement. Initial phase implementation costs typically run 15-25% higher per unit due to smaller volumes and setup inefficiencies. However, subsequent phases benefit from experience curve effects and volume purchasing advantages.
Modular system design facilitates staged implementation by enabling capacity expansion without complete system replacement. Modular HVAC systems cost 10-15% more initially but provide 40-60% cost savings for future expansion compared to complete system replacement. This approach proves particularly valuable for growing organizations with evolving cleanroom requirements.
Technology insertion strategies allow incorporating improved equipment generations during expansion phases. Organizations implementing 3-5 year staged programs often achieve 20-30% better total system performance compared to single-phase implementations through technology advancement integration.
Government Incentives and Tax Benefits
Manufacturing tax credits significantly impact effective cleanroom equipment ROI calculations for qualifying facilities. Section 179 deductions allow immediate expensing of equipment purchases up to annual limits, providing substantial tax benefits for profitable organizations. Bonus depreciation provisions further accelerate tax benefits for qualifying investments.
Energy efficiency incentives from federal and state programs reduce net equipment costs for high-efficiency systems. Utility rebate programs offer $500-2,500 per ton of high-efficiency HVAC equipment, while LED lighting conversions qualify for additional rebates. These programs typically require pre-approval and specific efficiency certifications.
Research and development tax credits apply to cleanroom equipment supporting qualifying R&D activities. Pharmaceutical, biotech, and technology companies often qualify for credits equal to 6-14% of qualifying equipment costs. Professional tax consultation ensures maximum benefit capture while maintaining compliance requirements.
How to Build a Realistic Cleanroom Equipment Budget for 2025?
Developing accurate cleanroom equipment budget projections requires systematic analysis of multiple cost factors and risk considerations. Successful budget development combines historical data analysis, market research, and scenario planning to create robust financial frameworks.
Budget Planning Templates
Comprehensive budget templates organize costs into logical categories that align with project phases and decision-making requirements. Primary categories include equipment procurement, installation and commissioning, validation and startup, and contingency reserves. Each category requires detailed line-item analysis to ensure complete cost capture.
Equipment procurement costs extend beyond list prices to include shipping, taxes, permits, and project management expenses. International equipment purchases require additional consideration of customs duties, currency exchange risks, and extended logistics timelines. Domestic sourcing typically adds 8-12% to list prices for delivery and setup, while international sourcing adds 15-25% including all landed costs.
Installation and commissioning typically cost 25-40% of equipment values for complex cleanroom systems. This includes foundation preparation, utility connections, control system integration, and performance testing. Specialized contractors command premium rates of $85-150 per hour, while project timelines often extend beyond initial estimates due to coordination complexities.
| Budget Category | Typical % of Equipment Cost | Risk Factors |
|---|---|---|
| Equipment Procurement | 100% (baseline) | Currency, shipping, delays |
| Installation & Commissioning | 25-40% | Contractor availability, site conditions |
| Validation & Testing | 15-25% | Regulatory requirements, performance issues |
| Contingency Reserve | 10-20% | Scope changes, unforeseen conditions |
Cost Estimation Tools
Parametric estimating tools provide rapid budget development capabilities based on cleanroom size, classification, and application parameters. These tools utilize historical cost databases to generate preliminary estimates accurate within ±25-35% for planning purposes. Detailed estimates require vendor quotations and site-specific analysis for ±10-15% accuracy.
Vendor quotation management becomes critical for competitive procurement and accurate budgeting. Request for quotation (RFQ) documents must specify complete requirements including installation, training, warranties, and ongoing support to enable meaningful comparisons. Vendor responses typically vary 20-40% due to different interpretation of requirements and value proposition approaches.
Life cycle cost modeling tools evaluate total ownership costs over extended analysis periods. These models incorporate equipment costs, energy consumption, maintenance expenses, and replacement timing to optimize long-term value delivery. Sensitivity analysis capabilities help identify cost factors with greatest budget impact and risk exposure.
Risk Management Strategies
Contingency planning addresses budget risks through systematic identification and mitigation strategies. Technical risks include equipment performance shortfalls, integration challenges, and validation delays. Commercial risks encompass price escalation, delivery delays, and contractor performance issues. Comprehensive risk registers assign probability and impact assessments to enable informed contingency allocation.
Price volatility management becomes increasingly important with extended equipment lead times and supply chain uncertainties. Fixed-price contracts provide budget certainty while transferring risk to suppliers who typically charge 5-10% premiums for price protection. Escalation clauses based on material and labor indices offer compromise approaches balancing cost and risk considerations.
Change management processes control scope creep and budget overruns through formal approval procedures and impact analysis requirements. User requirement changes during design and construction phases create budget pressures that proper change control minimizes. Experience indicates that facilities with rigorous change management processes complete projects within 5-8% of approved budgets compared to 15-25% overruns for less disciplined approaches.
Conclusion
Strategic cleanroom equipment cost management requires comprehensive analysis spanning initial investments, operational expenses, and long-term value optimization. Successful organizations achieve 280-450% ROI through systematic equipment selection, financing optimization, and lifecycle cost management. The key insights from 2025 market analysis demonstrate that premium equipment investments generate superior long-term returns despite higher initial costs, while hidden costs frequently represent 40-65% of total investment over operational lifespans.
Effective budget planning combines detailed cost modeling with risk management strategies that address technical, commercial, and operational uncertainties. Organizations implementing staged deployment approaches and leveraging government incentives optimize capital utilization while maintaining technology currency. The most successful facilities establish comprehensive maintenance programs and energy optimization initiatives that compound value creation over equipment lifecycles.
Looking ahead, cleanroom equipment markets will continue evolving toward IoT integration, energy efficiency improvements, and modular system designs that enhance operational flexibility. Organizations preparing for these transitions through strategic equipment planning and budgeting will capture competitive advantages while minimizing total ownership costs.
For facilities ready to optimize their cleanroom equipment investments, comprehensive planning tools and expert consultation provide the foundation for successful project delivery. Consider how your current equipment strategy aligns with long-term operational objectives and market positioning requirements. Advanced cleanroom equipment solutions offer the performance, efficiency, and reliability that transform operational capabilities while delivering measurable ROI improvements.
Frequently Asked Questions
Q: What is a Cleanroom Equipment Cost Analysis, and why is it important for businesses in 2025?
A: A cleanroom equipment cost analysis is crucial for businesses operating in sectors like pharmaceuticals, biotechnology, and electronics, as it helps assess the financial viability of investing in cleanroom infrastructure. This analysis considers factors such as equipment costs, maintenance, and potential returns on investment (ROI), providing valuable insights for strategic decision-making.
Q: How do I calculate the ROI of cleanroom equipment using an ROI calculator in 2025?
A: To calculate the ROI of cleanroom equipment using an ROI calculator in 2025, follow these steps:
- Determine the initial cost of the cleanroom equipment.
- Estimate the annual benefits or savings from using the equipment.
- Calculate the net gain or savings over a specified period.
- Use the ROI formula: ROI = (Net Gain / Total Cost) * 100.
This process helps you evaluate the financial performance of your cleanroom investments.
Q: What factors influence the cost of cleanroom equipment in 2025?
A: Several factors influence the cost of cleanroom equipment in 2025:
- Raw Materials: Costs of materials like Acrylonitrile Butadiene Rubber (NBR) and polypropylene can fluctuate.
- Labor and Installation: Labor costs and the complexity of installation.
- Technology and Customization: The level of technological sophistication and customization required.
- Supply Chain and Logistics: Changes in global supply chains and transportation costs.
Q: How does a cleanroom equipment cost analysis support business strategy in 2025?
A: A cleanroom equipment cost analysis supports business strategy by providing a comprehensive view of expenditures and potential returns. This analysis helps businesses:
- Optimize Budgets: Make informed decisions about resource allocation.
- Enhance Efficiency: Identify areas for cost reduction and process improvement.
- Improve Competitiveness: Position the company for market growth by investing in the right equipment.
Q: What are the key trends affecting cleanroom equipment costs and ROI in 2025?
A: Key trends affecting cleanroom equipment costs and ROI in 2025 include:
- Technological Advancements: Improved efficiency and lower operational costs.
- Regulatory Compliance: Stricter standards for contamination control.
- Global Supply Chain Shifts: Changes in raw material costs and logistics.
External Resources
- The Ultimate Guide To Equipment ROI Calculation – Provides a step-by-step guide and formula for calculating equipment ROI using net profit and cost of equipment.
- How to Calculate Your Equipment ROI – Cheqroom – Explains ROI calculation for equipment, including direct and indirect benefits, and offers practical examples.
- Cost to Clean Room – 2025 Cost Calculator (Customizable) – Offers a 2025 calculator for estimating cleaning costs per cleanroom, useful for cost analysis.
- 2025 International Hi-Tech/Manufacturing/Cleanroom Facilities Estimating Yearbook PDF – Contains current cost data and estimating resources for cleanroom and manufacturing facilities in 2025.
- Modular Cleanroom Cost Analysis – Technical Air Products – Analyzes initial and long-term costs of modular cleanrooms, ROI benefits, and operational savings.
- Cleanroom Design, Build, and Commissioning (Spartan Controls) (Closely related) – Focuses on cleanroom solutions, design, and cost considerations for optimization and ROI in cleanroom environments.
Related Contents:
- Mobile LAF Cart ROI: Investment Calculation Guide
- Weighing Booth ROI: Maximizing Your Investment
- Calculating LAF Unit ROI: Is the Investment Worth It?
- Cleanroom Sink Investment: Calculating Long-Term ROI
- LAF Garment Cabinets: Balancing Quality and Budget
- Maximizing ROI: The Cost-Benefit Analysis of HPL Cabinets
- Calculating ROI: Are HEPA Housing Boxes Worth the Investment?
- VHP System Maintenance: Annual Cost Breakdown 2025
- VHP Pass Box Cost Guide: 2025 Pricing & ROI Calculator
